Recent Search
Popular Searches

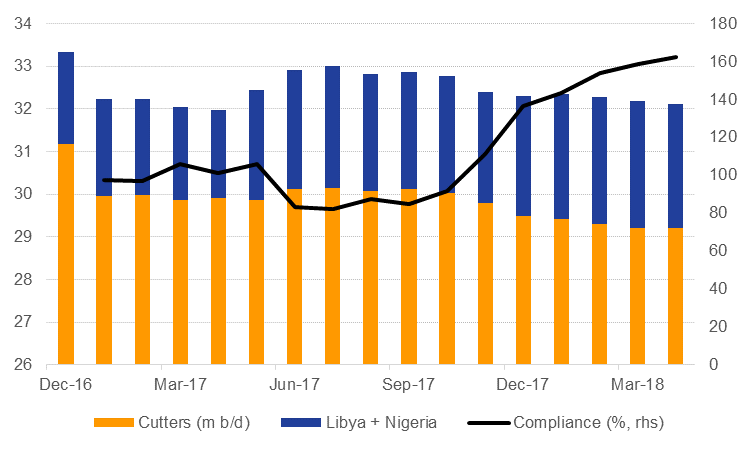
OPEC recorded another month of over-delivering on its agreed oil production cuts as collective output fell to 32.12m b/d, according to market surveys, its lowest level since April 2017. Among the countries that are contributing to the cuts, total production was 29.2m b/d, its lowest level since the agreement came into effect. Compliance with the deal remains at extremely high levels, over 162% in April, and has recorded an average of 155% so far this year.
 Source: Eikon, Emirates NBD Research.
Venezuela remains the main contributor to the lower volumes in 2018 as production continues to collapse. Output in April was just 1.5m b/d, more than 500k b/d below year ago levels. We have noted previously that Venezuela represents one of the biggest downside risks to OPEC production and we expect to see further deterioration in volumes throughout the year. A presidential election in the country scheduled for later this month could be the catalyst for further US sanctions on Venezuela, including on oil imports from the country.
The oil market’s current sanctions fixation, however, is more firmly focused on Iran. US president Donald Trump will make a decision on whether to renew waivers on Iran sanctions by May 12 with the market expecting some disruption to Iranian oil flows. A recent push by European allies appears to have failed to shift Trump’s thinking on sticking to the terms of the Joint Comprehensive Plan of Action, the nuclear deal.
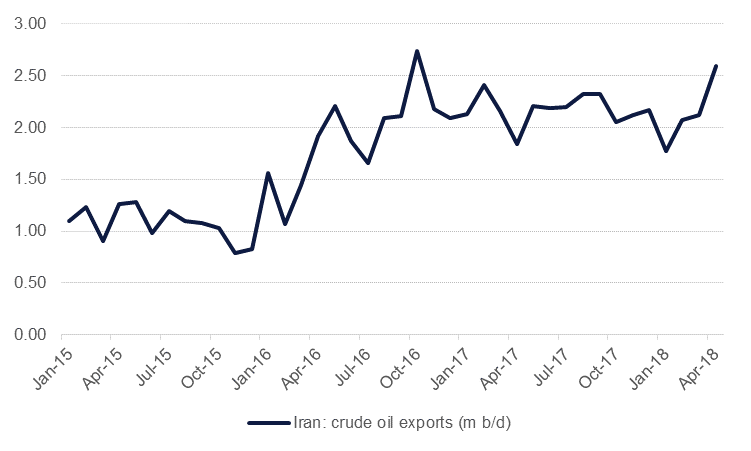
The main sanctions that impact the oil market are US restrictions on foreign banks that carry out transactions with Iran’s central bank and exemptions only being granted if importers ‘significantly reduce’ imports of Iranian crude. Iranian crude oil exports dwindled to less than 1m b/d under the 2012 sanctions and have since recovered strongly, rising to roughly 2.6m b/d in April according to Reuters estimates. The uptick since the start of the year may be related to purchasers seeking to front-load purchases ahead of the May deadline.
 Source: Eikon, Emirates NBD Research.
China, Japan, India and South Korea are among the largest individual importers of Iranian crude and would be under heavy scrutiny to demonstrate reductions in their imports of crude in order to avoid sanctions. In 2012 both South Korea and Japan cut imports sharply to avoid sanctions (Japan has yet to boost its purchases to pre-sanction levels). We would expect South Korea to cut back its volumes by at least as much as 200k b/d in order to comply with sanctions as diplomatic relations between the US and South Korea are on a strong level following recent successful efforts to ease tensions with North Korea. India imported around 500k b/d of Iranian crude last year compared with less than 200k b/d during 2015. India has been actively courted by other Middle East producers, including the UAE and Saudi Arabia, and imports from Iran have been trending lower since around October 2016 (albeit from high levels).
The EU has also been a significant importer of Iranian crude, particularly Spain, Italy and Greece. Despite European opposition to abrogating the JCPOA we would expect compliance with US sanctions could cut flows by at least 500k b/d and likely another 100k b/d from a decline in Turkish imports.
The main question mark around importers of Iranian crude is China. During the sanctions period China cut its imports of Iranian crude slightly and they have trended up since the JCPOA came into effect in 2016. On past performance we don’t anticipate that China would cut back its imports of Iranian crude for several reasons:
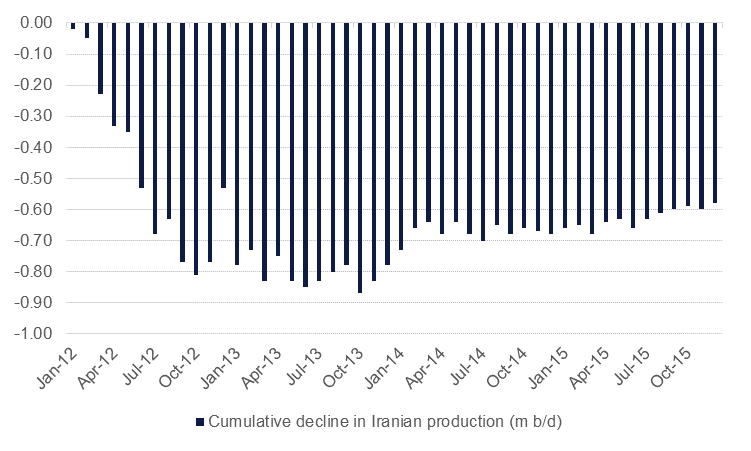
All told, we estimate up to 1m b/d of Iranian exports would be at risk from US sanctions were they imposed after the May deadline. A decline in exports and production could be rapid if president Trump forgoes the 180-day adjustment period provided for under the 2012 sanctions regime. In 2012 Iranian oil production fell by more than 800k b/d in 10 months and remained around that trough until 2014 when production began to gradually climb upward. While US sanctions on trading with Iran’s central bank commenced in January 2012 the provision targeting oil only came into effect from the end of June that year, showing Iranian counterparties sought to divest themselves away from Iran even ahead of sanctions coming into force.
 Source: Eikon, Emirates NBD Research
The US sanctions require an assessment by the EIA on the status of global oil supply and whether it could accommodate a reduction in purchases of Iranian crude by major importers. In 2012 oil markets were relatively well supplied thanks to production increases from Saudi Arabia and other GCC producers, along with a temporary recovery in Libya’s production. Markets were relatively undersupplied in 2013 but in 2014-15 the impact of shale production in the US was beginning to be felt and contributed to a market surplus, meaning Iranian exports could dip as importers found alternate cargoes.
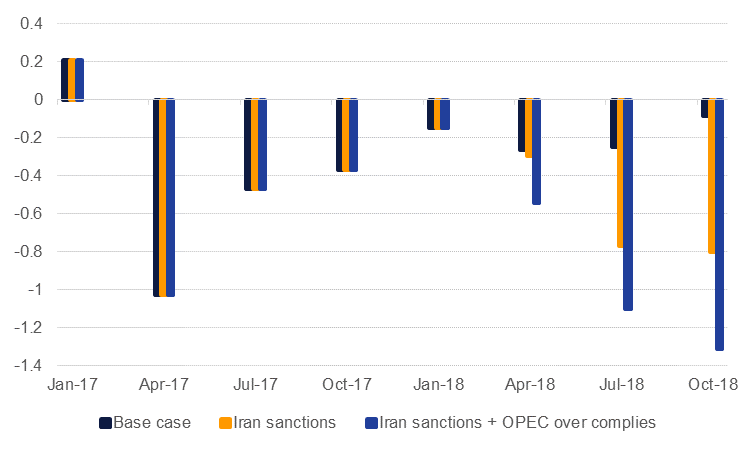
Do the current market conditions allow for a reduction in Iranian exports by as much as 1m b/d? Our forecast for 2018 already shows a modest market deficit this year thanks to production cuts from OPEC and its partners. If sanctions came into effect on Iran and output fell roughly on pace with the decline in 2012 we would expect to see a market deficit approaching 800k b/d in H2 2018. OPEC members certainly hold enough spare capacity to more than make up for any Iranian shortfalls: just Saudi Arabia, the UAE and Kuwait alone could increase output to ensure markets were balanced to accommodate a decline in Iranian volume.
However, unlike 2012, we are not confident other OPEC members would increase production to make up for lost Iranian output. OPEC has so far been reticent to make up for the lost Venezuelan barrels as key members—namely Saudi Arabia—now appear fixated on higher prices to support a nebulous goal of greater investment in oil and gas production
Our forecast for OPEC production this year was based on an increase in output but this has yet to materialize. If OPEC compliance in the first four months of 2018 is anything to go by, the producers’ bloc may be prepared to let oil markets scream and push balances into a deficit of more than 1m b/d in second half of the year, even with non-OPEC supply growth of nearly 2m b/d y/y in H2.
 Source: IEA, Emirates NBD Research
A market deficit around 1m b/d or greater appears to imply a sizeable increase in average Brent prices y/y. On average stretching back to 2008, deficits of this size have correlated with price gains on average of around 30% y/y. This could result in Brent prices of close to USD 68/b in Q3 and nearly USD79/b in Q4, all other factors remaining equal. We stress this is not our core forecast as there are several moving parts that could radically reshape market balances going into the second half of the year, not least of which could be a marked slowdown in demand, an appreciation of the US dollar or supply response exceeding our expectations.
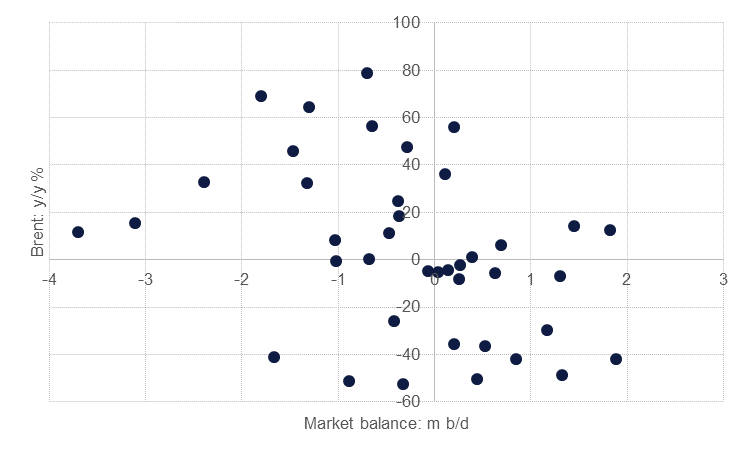 Source: IEA, Emirates NBD Research. Note: data from 2008-17 for Brent futures.
 Edward Bell
